We use cookies from thirth parties to inprove your experience and our services. If you do not close this window we understand that you allow its use. For more information about cookies click here
Cerrar

 | Download article | Times downloaded:
672
| Download article | Times downloaded:
672
1. Previous information
Response spectra of an earthquake. Design response spectra.
A response spectra is a graph which provides the information about the maximum responses (displacement, velocity or acceleration) that will happen to a structure under the effect of an earthquake in function of its vibration frequency, its damping and other parameters.
For the design of the structures, these design response spectra is used. A structure cannot be designed for a particular earthquake, as for the following one the spectra will be different. For this reason, to design a structure is used a spectra calculated as the result of the envelope of the different typical earthquakes of the area. The codes provides different methodologies to calculate them and depends, mostly, on the maximum acceleration of the bedrock of the emplacement and other factors like the type of soil or what it is called the importance factor.
A design response spectra has the following shape:

In the following link it can be found a detailed explanation of the design response spectra and their calculation procedure. The aim of this article is to show how to calculate a structure of several degrees of freedom under an earthquake.
http://www.sginstitute.in/activities/Civil/Day_6_1.pdf
2. Structure under earthquake hand calculation example
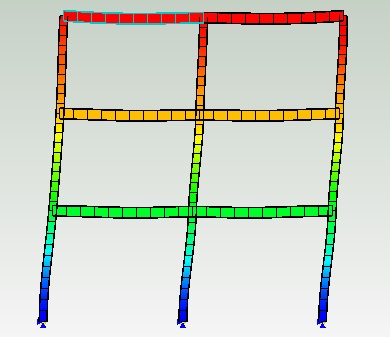
The best way to understand how to calculate a structure under the effects of an earthquake is to do it for a real particular case. In this article we will study the effect of a horizontal earthquake on a two storey building. To simplify the calculation we assume that the mass of the columns in negligible and that both storeys, for horizontal forces, are totally rigid. The picture of the next section shows the simplification of the studied structure. For this simplified structure we will obtain its vibration modes and the associated frequency, and we will explain how calculate the reaction on the base of the building for a given design response spectra.
Calculation example:
The two level storey shown in the following picture will be studied using a simplified lumped masses model. We will calculate the vibration modes and we will calculate the reaction on the supports of the structure under a design response

Input data:
Module Young: E:30000000kN/m2
Supports section: 30cmx30cm
Heigh of each level: h:3m
Area= 30cm x 30cm = 0.09m2
Inercy= 30cm x (30cm)^3 / 12
Given the two storey building shown above, the considered degrees of freedom are the horizontal displacement on each floor (v1 y v2). Its mass matrix M and its stiffness matrix K are the following ones:

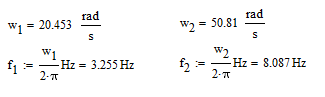
The vibration frecuency of the vibration modes can be calculated from the w values that solve the following equantion. We remind to the reader that we will have as many vibration modes as degrees of freedom our structure has (2 for this example):
![]()
To calculate the deformed shape of each vibration mode, we have to solve the following equation for each w value calculated above:
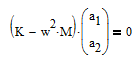
Where the “a1” and “a2” values correspond to the horizontal displacements of each degree of freedom of each vibration mode. We remind that these displacements are normalized to the first degree of freedom; this means that the value for the first degree of freedom is always 1 and the others are calculated in function of this one. Solving:

Here below are provided the dynamic equations of the structure under earthquake:
![]()
Where:
![]()
The solution to this equation if it is a seismic excitation is given by (Duhamel’s integral):

The equation (1) can be uncoupled using the vibration modes, substituting:
![]()
Solving the equation we obtain (the explanation of how to solve this equation is out of the scope of this article):

This equation will be used to calculate the maximum displacement of each mode.
A new variable (Sa) is used that needs to be defined. The acceleration response (Sa) is defined as the maximum value of |ẍ+a(t)|, this value is obtained from the acceleration response spectra calculated with the code using the vibration period of each mode (i) of our structure:

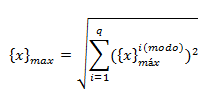
To obtain the maximum displacement of the structure we have to remind that for each degree of freedom, the maximum displacement of each mode is not produced at the same moment, this means that the total displacement will not be the algebraic sum of the displacements of each mode for each node. There are several formulas to obtain the maximum expected displacement on each node using the displacement of each vibration mode. One of the most used formulas for this purpose will be used in this article and is shown here below:
Using this brief explanation we will obtain de values on our particular case:
For the mode 1 whose frequency is 3.255Hz (T=0.307), using the acceleration response spectra, we obtain an acceleration Sai=2.
For the vibration mode 2, whose frequency is 8.087Hz (T=0.123), using the graph of the acceleration response spectra we obtain an acceleration Sai=1.615 (calculated in the las curve of the graph, which has the equation Sa=1+5T).
Introducing our values in the formulas explained above we obtain:

The maximum displacement for the first vibration mode, for each degree of freedom, is:

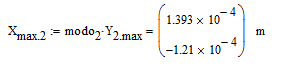
The maximum displacement for the second vibration mode, for each degree of freedom, is:
Using these displacements we can obtain the reactions on the support of our simplified structure for each vibration mode. We will apply the well known formulas from the engineering mechanics imposing the calculated displacements to the structure:
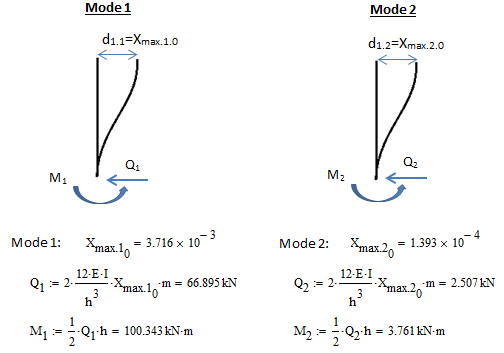
As explained above, the reactions for each mode will not be produced at the same time. Using the formula presented above we obtain de maximum shear force and bending moment for each support of the structure (it is reminded that we divide by 2 the values as we want to know the reactions on each column, we simplified the model using only one column with twice the rigidity of each column):
![]()
It would be interesting to compare these values to those obtained using an equivalent static force. This article will be published in the future.
This article is traduced from our Spanish version of Prontubeam, therefore the references and other sources of information are in Spanish:
[1] http://blog.uca.edu.ni/estructuras/files/2011/02/espectros-de-respuesta-y-de-dise%C3%B1o.pdf
[2] http://nicolatarque.weebly.com/uploads/1/2/6/9/12699783/anlisis_ssmico_edificios.pdf
[4] Spanish version of the article, published in www.Prontubeam.com
| Download article | Times downloaded:
672